Research Facilities
Research Laboratories and Facilities
CAS Laboratories
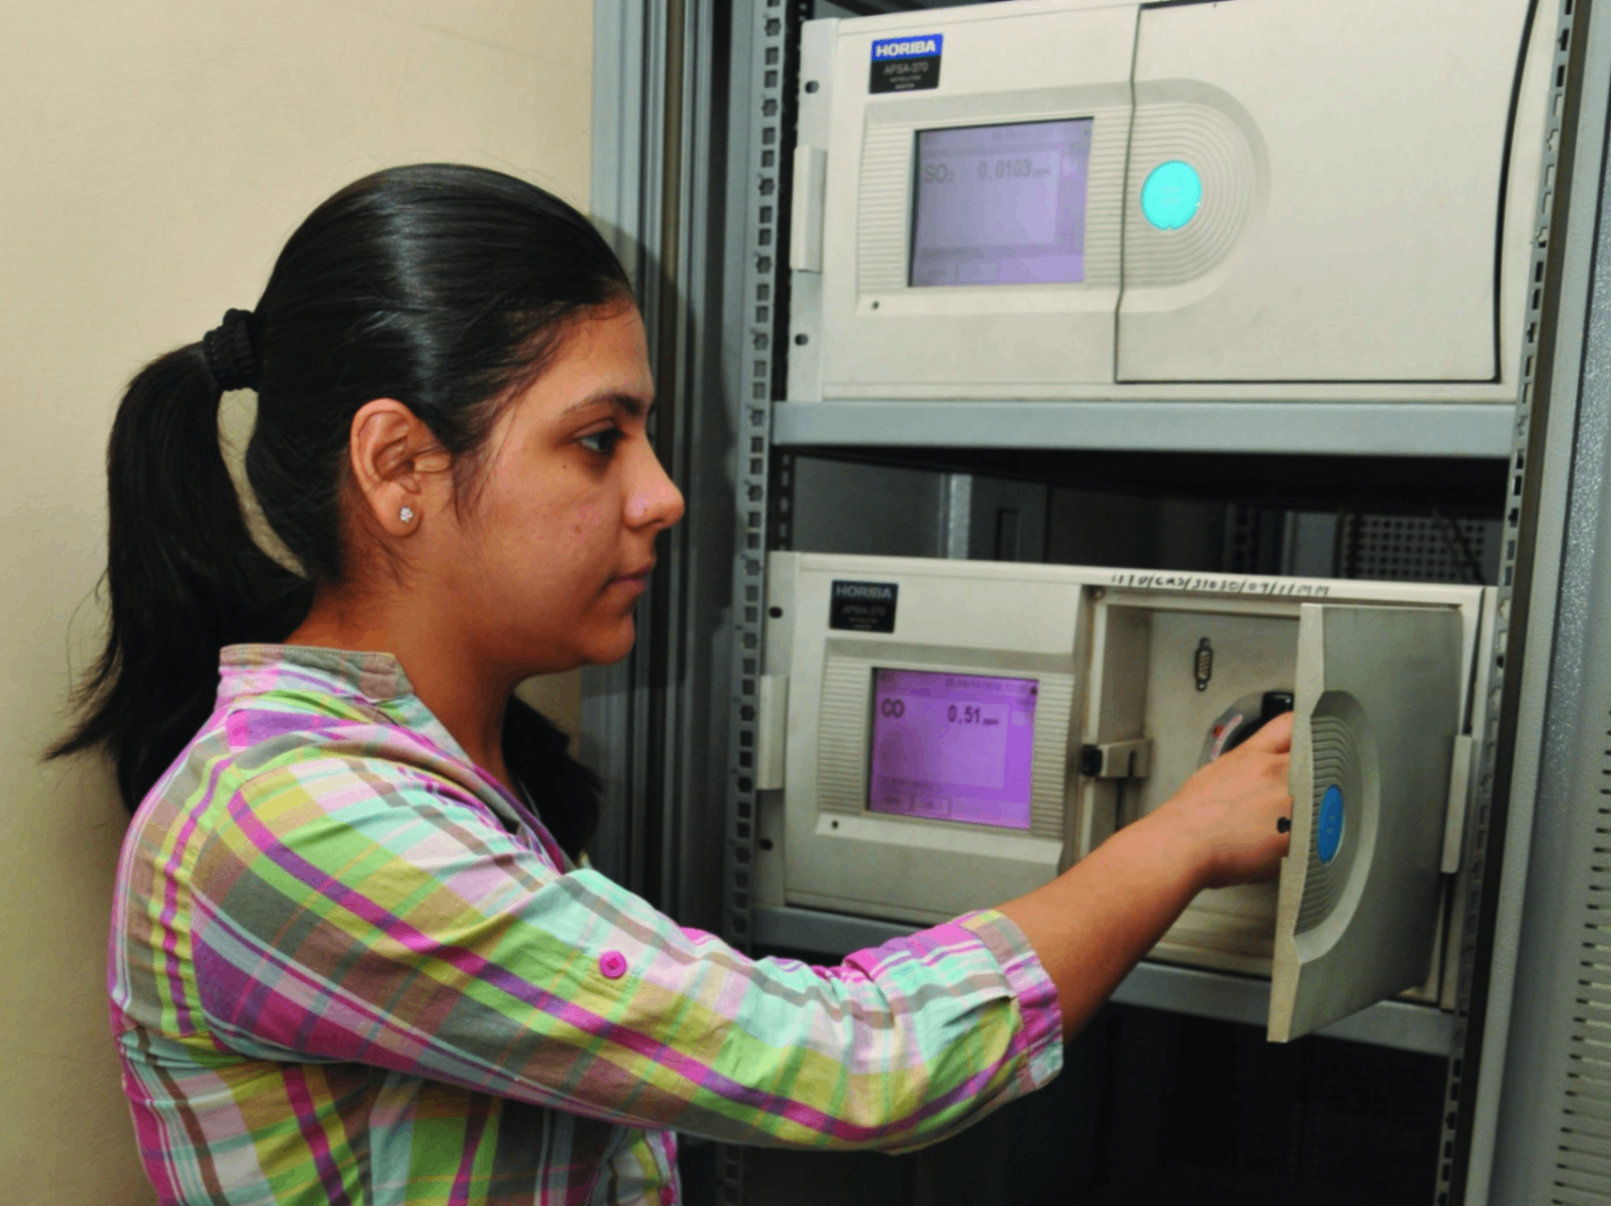
In addition to the Atmospheric Observatory at the Sonipat campus, CAS has a state-of-the-art atmospheric observational research facility at the IIT-Delhi main campus. CAS laboratories include the instruments such as aerosol and gas analysers, Microptops radiometer, Aethalometer, Spirometer, Albedometer.
Computing Facility
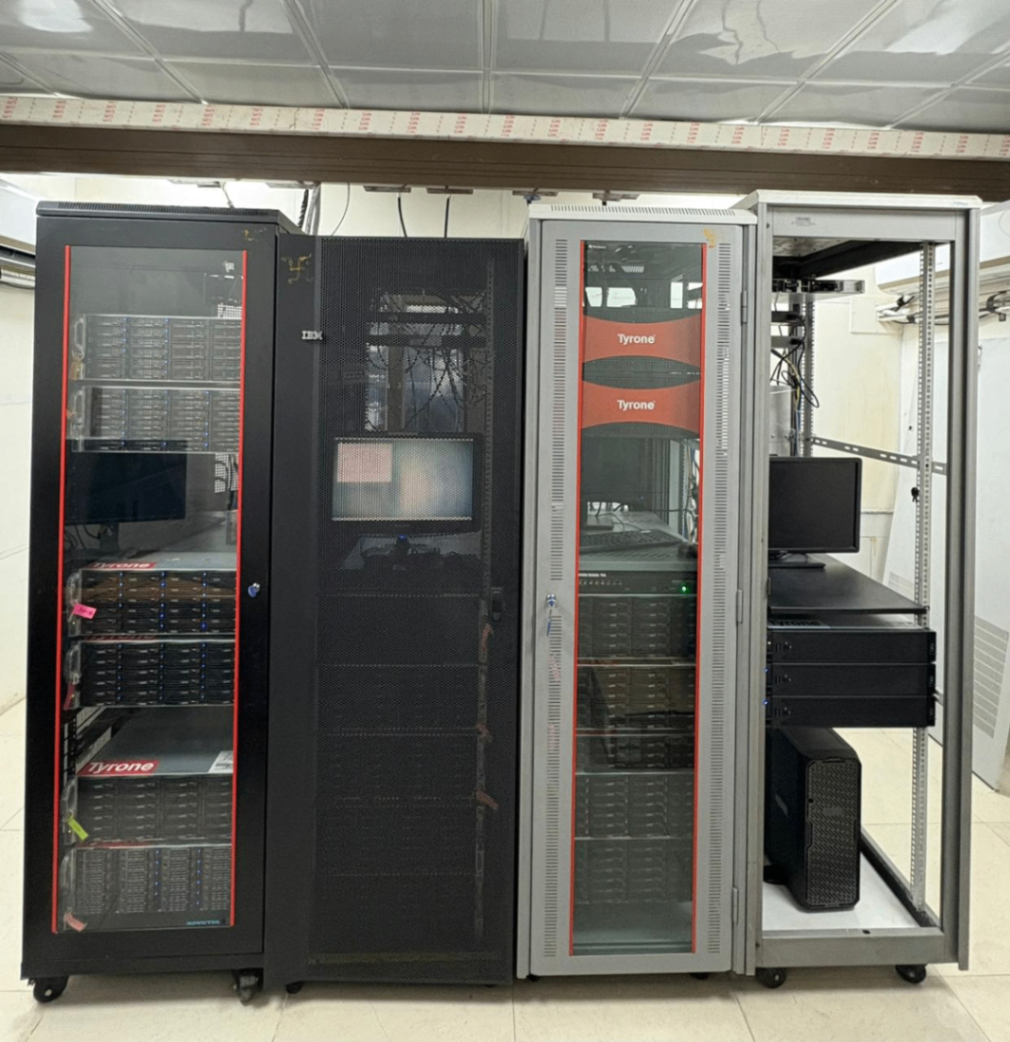
The computing laboratories at the Centre are equipped with state-of-the-art desktop workstations for data analysis and visualization software. IIT Delhi has network backbone connectivity of 10 Gbps across the entire Institute. Computing laboratories at CAS are connected to the backbone through 10Gbps /1Gbps network switches. The following high-performance computing clusters and storage servers are available at CAS for conducting numerical modeling:
1) SIKKA : A 320 TB Storage-cum-data analysis server
2) KRISH: A 256 TB storage cum data analysis server
3) Storage Server: A 115TB data storage server
CAS researchers actively use the IIT Delhi High Performance Computing facility: IIT DELHI PADUM HPC SYSTEM
Atmospheric Observatory at Sonipat, Haryana
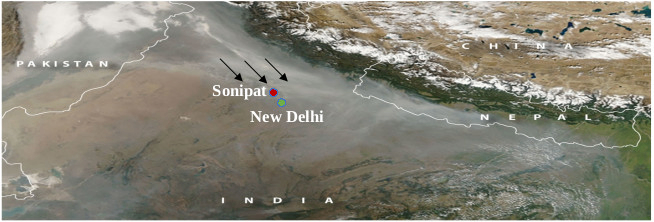
Centre for Atmospheric Sciences (CAS), IIT Delhi, has created a world-class atmospheric observation research facility in its Sonipat campus. The Sonipat observatory is currently equipped with six instruments in three focus areas: air pollution, climate, and weather. The observatory will be equipped with numerous state-of-the-art equipment with the latest technology such as radars, lidars, and mass spectrometers to study the atmosphere and climate system. The observatory will enable researchers to make new discoveries about our climate system and find sustainable solutions to some of the country's pressing problems like severe air pollution, erratic monsoon, and various other extreme weather events associated with climate change.
Based on data published by the World Health Organization (WHO)1, New Delhi and 11 other North Indian cities rank among the world's top 25 cities with the worst air quality. In India, poor air quality is estimated to cause more than a million deaths every year2 and a loss of 1.44% of its GDP3. India is also extremely vulnerable to the impact of climate change. Every year, it faces extreme weather events in floods and cyclones, which take lives, destroy homes and agricultural yields, and result in substantial revenue losses. For the last two decades, India has been experiencing more erratic monsoon and extreme air pollution events, thereby posing a real threat to Indian agriculture and our economy.
Continuous long-term monitoring of air pollution and meteorology from this observatory will help us estimate trends and impacts of policy intervention on air quality and regional climate. Real-time source apportionment of air pollutants using observations and modeling from this observatory will provide actionable information to the concerned authorities with immediate and long-term abatement strategies. Measurements of toxicity of air pollutants using state-of-the-art equipment and measurement techniques will enable researchers for the first time to generate an India-specific dose-response function for the health impact of air pollution. Real-time data on vertical profiles of air pollution, clouds, and meteorological conditions will help researchers understand some of the complex atmospheric processes in a much better way. The knowledge gained from the observations will improve the representation of air pollution and clouds in air quality forecasting and monsoon prediction models, thus, reducing errors in forecasting severe pollution, fog, rainfall, and other extreme weather events.
1 WHO Global Ambient Air Quality Database (update 2018) https://www.who.int/airpollution/data/cities/en/
2 Balakrishnan et al., “The impact of air pollution on deaths, disease burden, and life expectancy across the states of India: the Global Burden of Disease Study 2017”, Lancet Planetary health, 2019
3 India state-level disease burden initiative air pollution collaborators (2021), Health and economic impact of air pollution in the states of India: the Global Burden of Disease Study 2019, Lancet Planetary Health.
Atmospheric Observatory
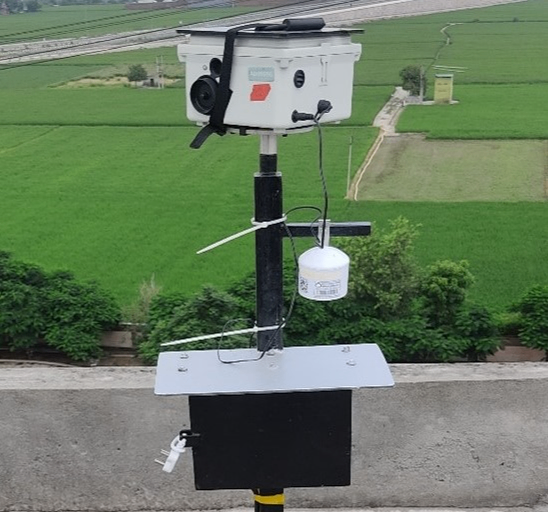
A world-class Atmospheric Observational research facility (Sonipat observatory) is currently equipped with six instruments in three focus areas: air pollution, climate, and weather. Instruments in place include Scanning Mobility Particle Sizer Spectrometer (SMPS) with Optical Particle Sizer (OPS) and DustTrak, Time of Flight Aerosol Chemical Speciation Monitor (TOF- ACSM), Aerosol Mass and Optical Depth (AMOD) Sampler, Greenhouse gas (GHG) analyser, LiDAR Ceilometer with depolarization measurement, and Automatic Weather Station (AWS) with multiple meteorological and solar radiation sensors. The observatory will soon be equipped with numerous other state-of-the-art equipment with the latest technology, such as radars, lidars, and mass spectrometers to study the atmosphere and climate system.
Check here for details: Atmospheric Observatory
Commitments from National and International Agencies
Atmospheric Observatory: Instruments in Place
Theme I: Air Pollution
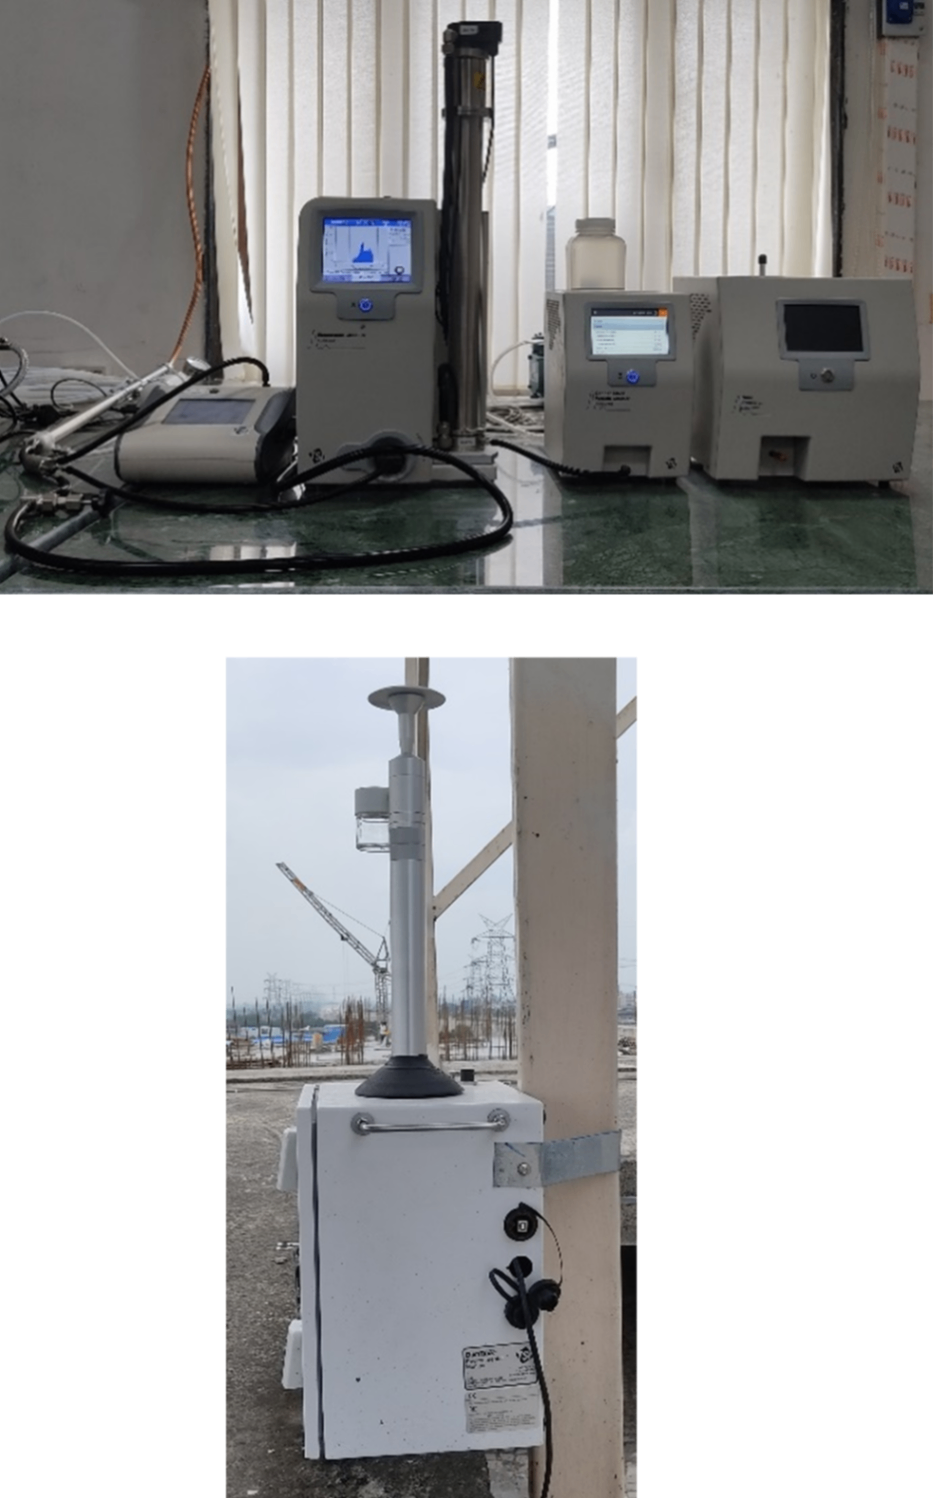
1. Scanning Mobility Particle Sizer Spectrometer (SMPS) with Optical Particle Sizer (OPS) and DustTrak
Instrument:
Integrated aerosol measurement system with TSI Model 3938-SMPS (Scanning Mobility Particle Sizer Spectrometer), model 3330-OPS (Optical Particle Sizer), and model 8543 DustTrak Environmental Monitor
Purpose:
Real-time measurements of aerosol number and mass concentration and aerosol size distribution (from nanoparticle to super-micron size range) at high resolution
Importance:
Aerosol particle size and concentration measurements are, in general essential for air quality monitoring and prediction
Real-time measurements help us understand the aerosol concentration variability at a high temporal resolution
Provides information to estimate emission sources of aerosols in the air
Used to describe the evolution of aerosol size distribution in chemical transport models
Other details:
Measure aerosol mass concentration as PM-total, PM10, PM2.5 and PM1.0
1-nm SMPS has capability for accurate nanoparticle sizing
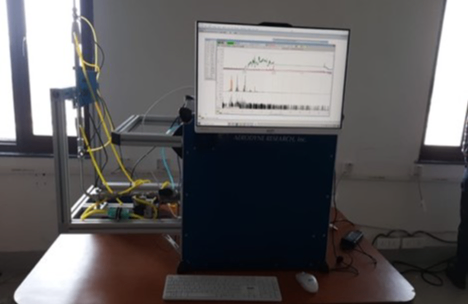
2. Time of Flight Aerosol Chemical Speciation Monitor (TOF- ACSM)
Instrument:
TOF - ACSM - PM2.5 (Time-of-Flight Aerosol Chemical Speciation Monitor) from Aerodyne Research, Inc.
Purpose:
Real-time measurements of non-refractory aerosol particle mass concentration and aerosol chemical composition
Importance:
Particulate Matter (PM) mass concentration measurements are, in general essential for air quality monitoring and prediction and air pollution health impact assessments
PM chemical composition measurements help to identify the toxicity of various chemicals in the air
PM and their chemical composition measurements help estimate the aerosol emission sources sectors
Other details:
High measurement sensitivity (10 minute, 3σ) for major PM particles such as organic (0.06 μg m-3), sulfate (0.006 μg m-3), nitrate (0.007 μg m-3), ammonium (0.06 μg m-3), and chloride (0.003 μg m-3)
Aerosol Size range: 40 nm to 1 μm (vacuum aerodynamic diameter)
Allows quantification of organic aerosol species including hydrocarbon-like organic aerosol
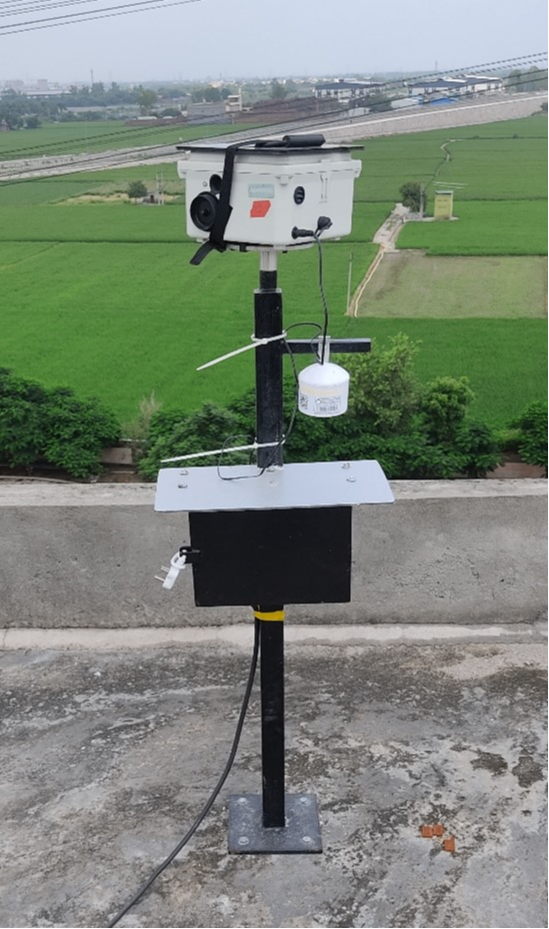
3. Aerosol Mass and Optical Depth (AMOD) Sampler
Instrument:
AMOD (Aerosol Mass and Optical Depth) sampler from NASA
Purpose:
Measurements of Aerosol Optical Depth (AOD) and surface-level PM2.5
Importance:
Simultaneous measurements of AOD and PM2.5 help researchers validate satellite-based aerosol monitoring
Provides information about the relation of AOD with surface PM2.5 concentration
PM2.5 mass concentration measurements are required to monitor and predict air quality and to assess PM2.5 public health impacts
Measurements of AOD help to understand the radiative effects of atmospheric aerosols
Provides data needed to characterize aerosol in the full atmospheric column
Theme II: Climate
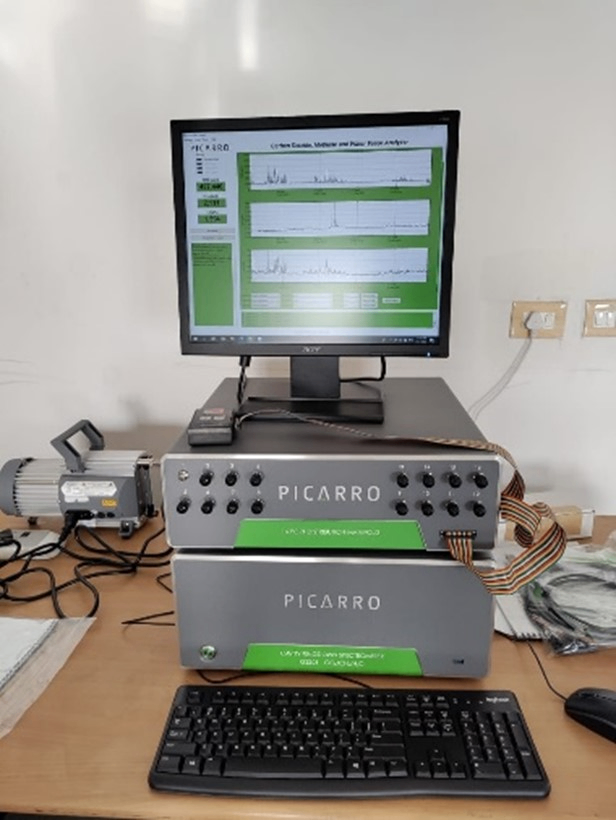
4. Greenhouse gas (GHG) analyser
Instrument:
PICARRO G2301 GHG (greenhouse gas) analyser based on CRDS (Cavity Ring-Down Spectroscopy) technology
Purpose:
Real-time continuous measurements of major greenhouse gases (GHGs) such as CO2, CH4, and H2O
Importance:
Help us understand the GHG temporal variability at a finer scale (say, hourly variation of CO2 concentrations in the ambient atmosphere)
To capture the sudden emission episodes and transport driven mixing
Help us to estimate the sources and sinks (fluxes) of GHGs
Other details:
Simultaneous and continuous measurements of atmospheric concentrations of GHGs such as CO2 (guaranteed precision over 5 seconds: < 50 parts per billion (ppb)), CH4 (< 1 ppb), and H2O (< 30 ppb)
Cavity Ring-Down Spectroscopy (CRDS) optical sensing technology-based laser gas concentration analyser